Attendance and reporting
See what is happening across your venues.
Review attendance, programme activity and location performance with filters that match your operation.
Book a demoThe workflow
How it works in QT
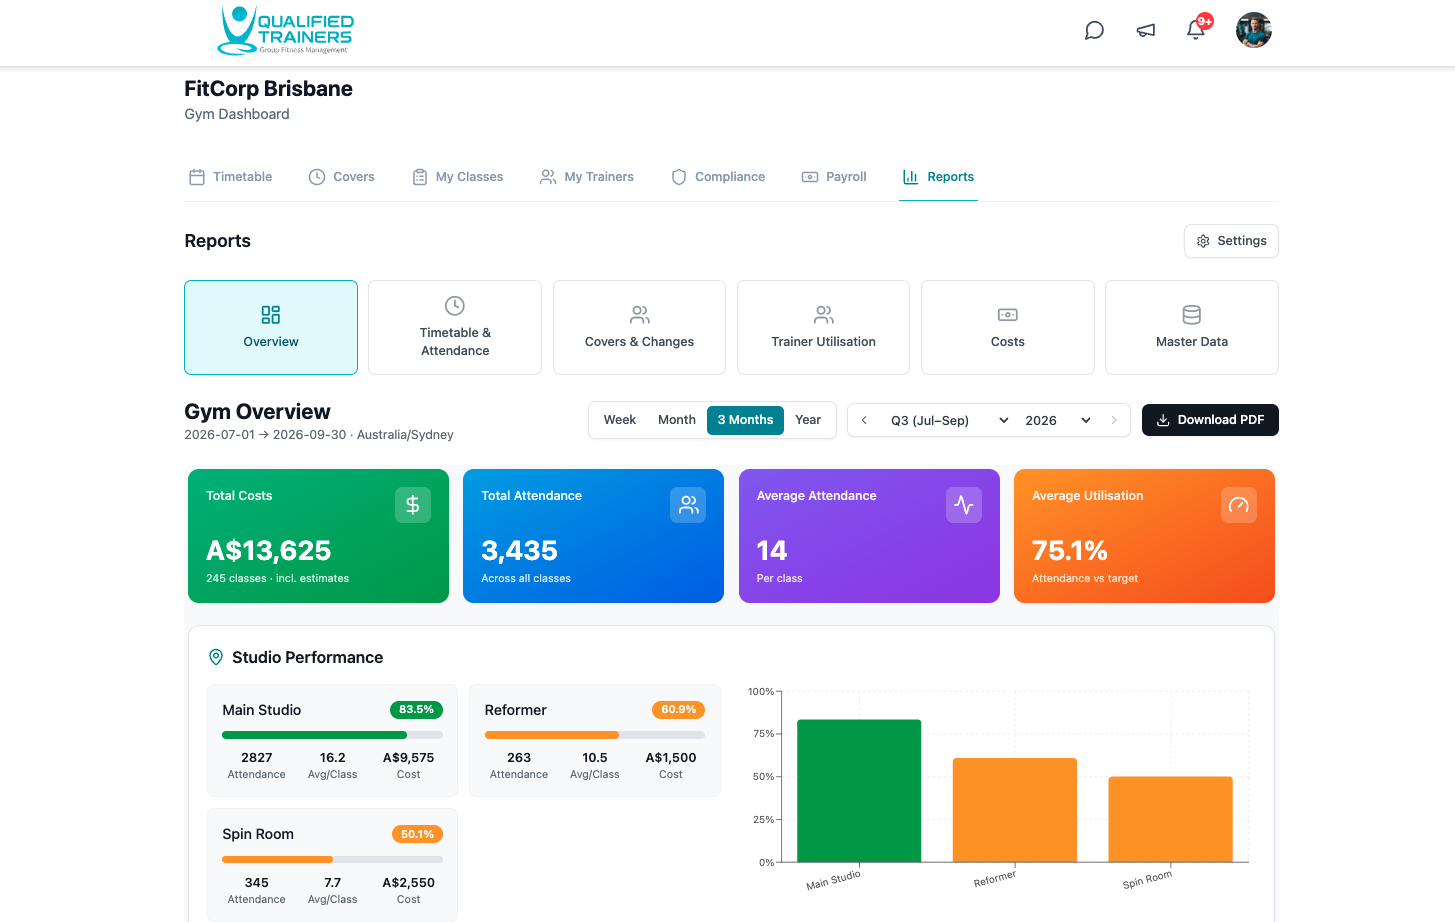
Move from a facility overview to the detail behind a class, studio or location. Compare attendance and fill rate, review timetable and cover activity, and use shared filters to examine the period or part of the business that matters.
- Class attendance and studio performance
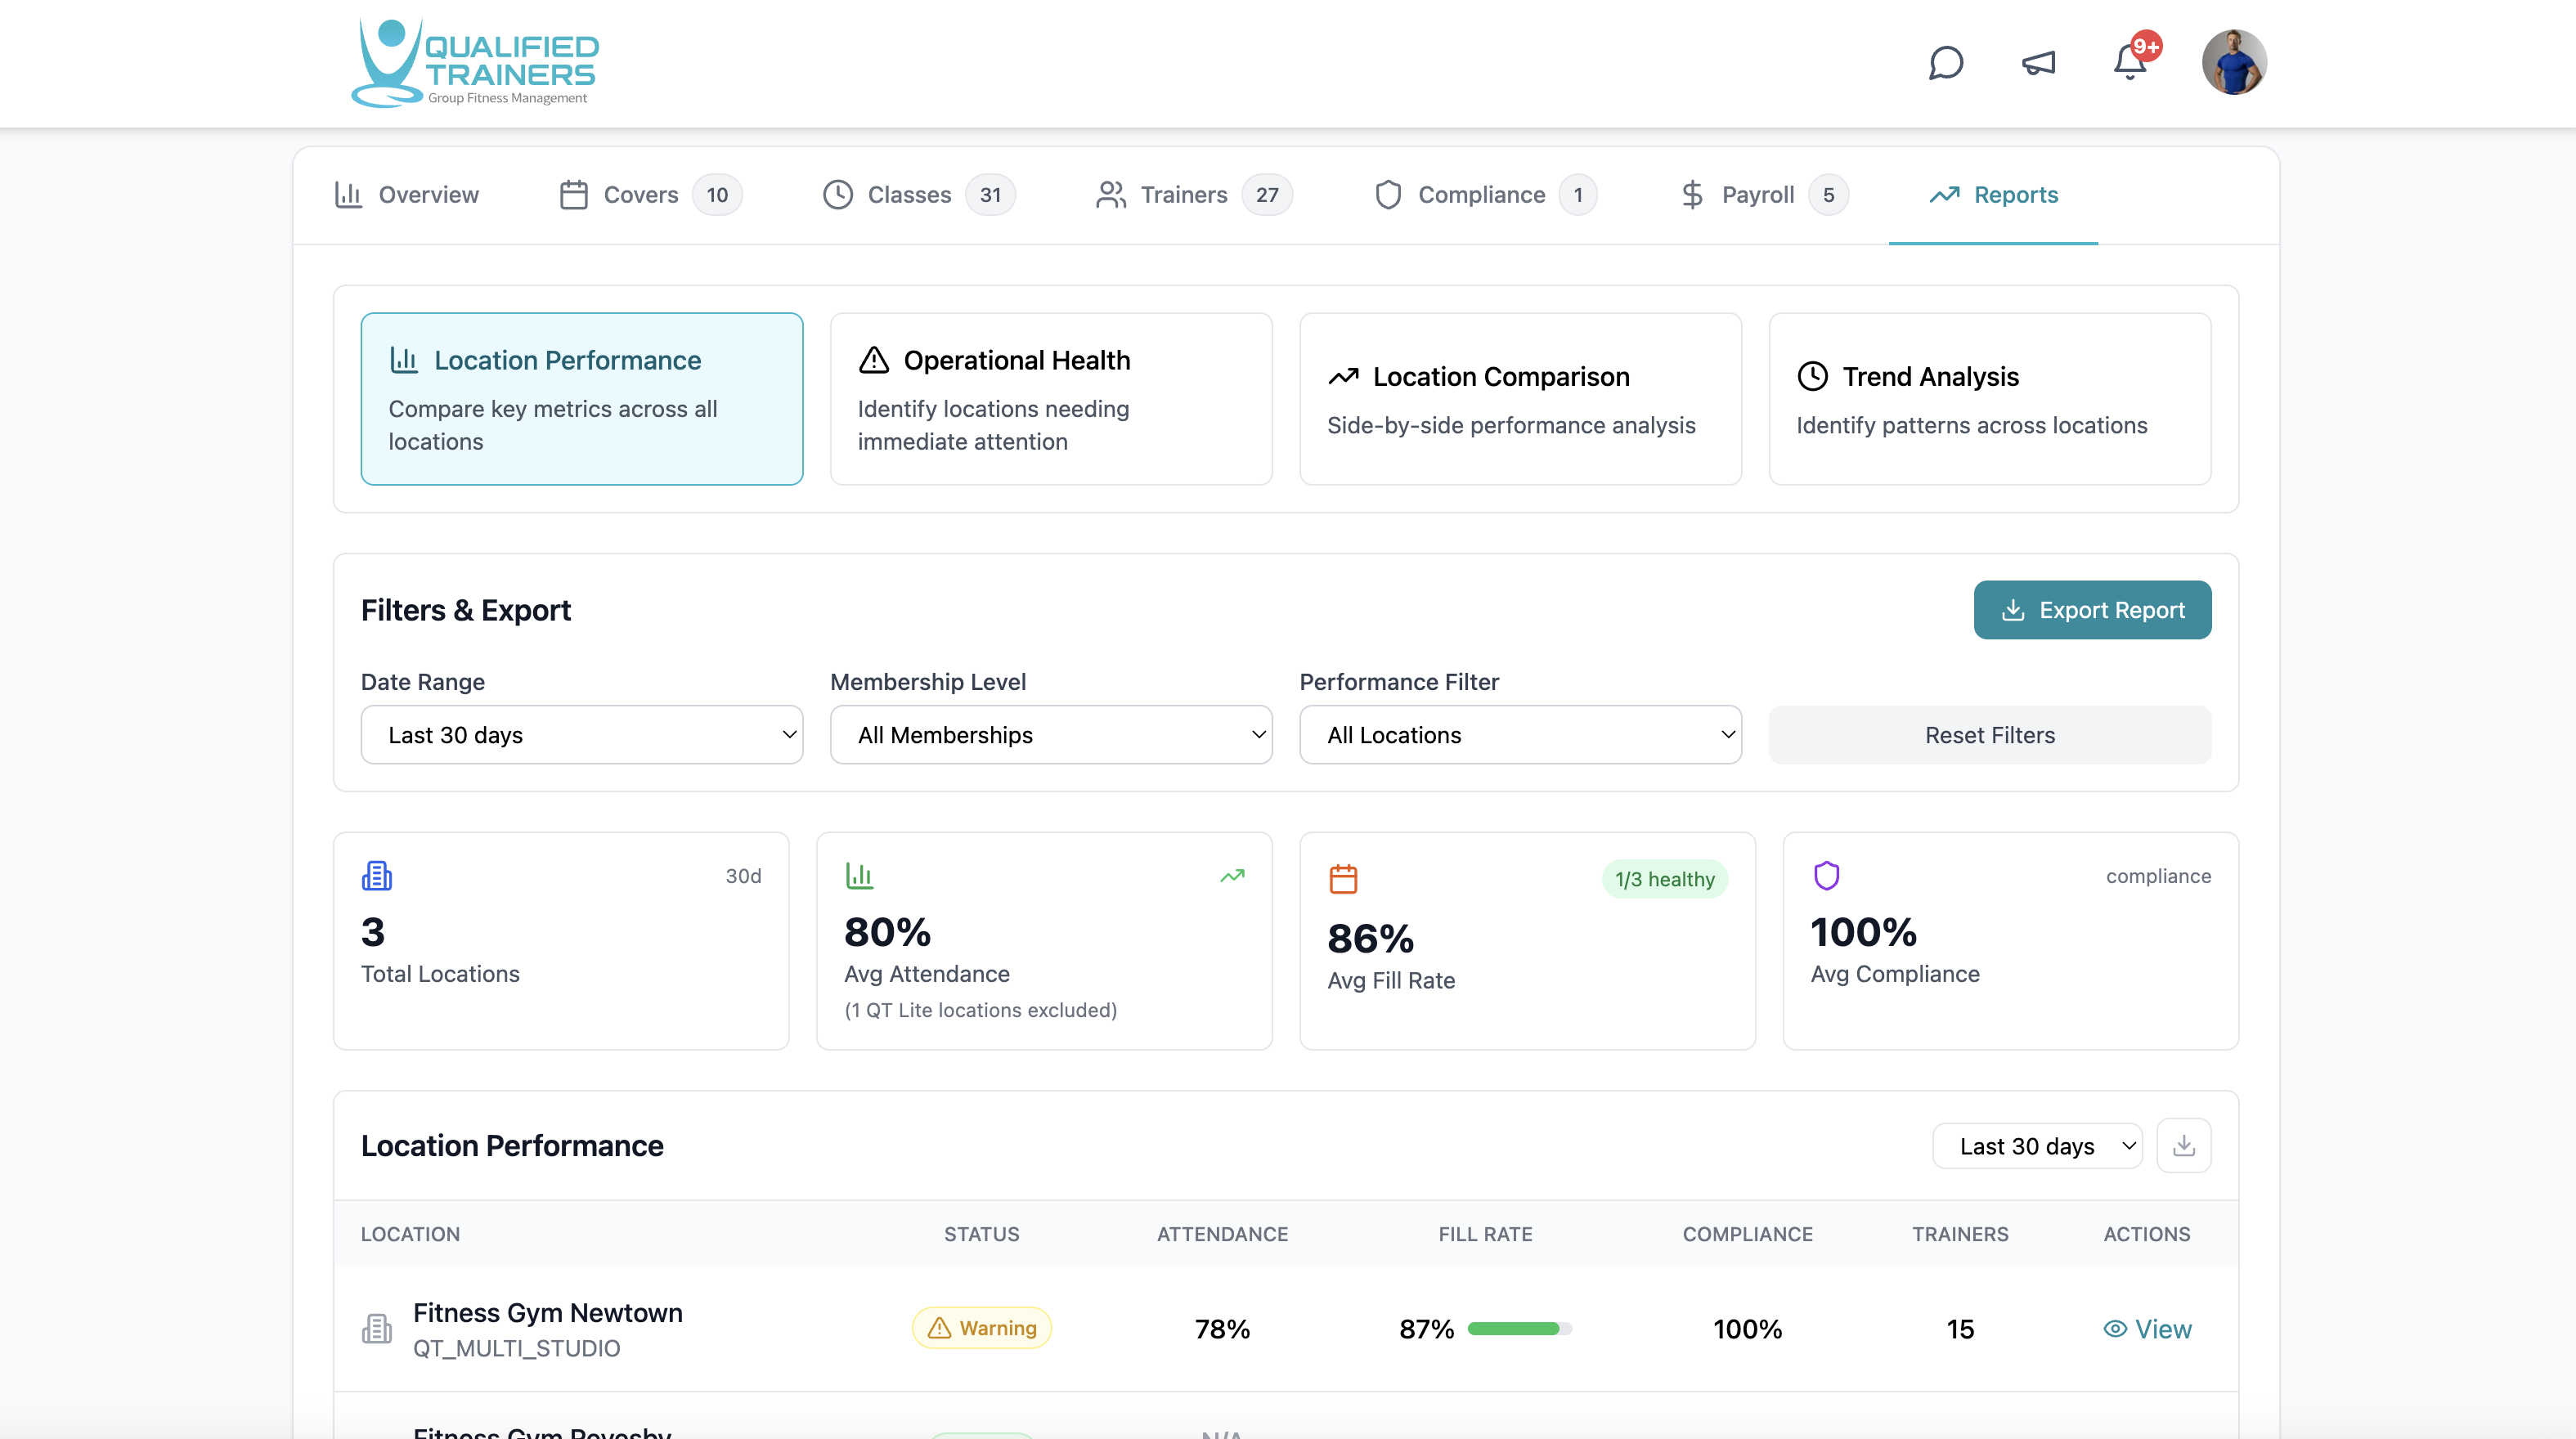
- Location comparisons and trends
- Filters, drill-downs and exportable tables
Features and benefits
Turn daily activity into useful decisions.
Understand class demand
Review attendance, fill rate and timetable performance to see which sessions are working and where capacity may need attention.
Compare locations
Look across venues in a common report view to spot differences in activity, performance and compliance.
Follow the detail
Filter by date and operational dimensions, then open the underlying class, studio or instructor view when a number needs context.
Share the findings
Export report tables for planning conversations and keep a consistent view of the figures your team is discussing.
Explore the rest of QT
See the other workflows or discuss your facility with our team.